| Exercise 9 (multiple graphs) | Exercise 10 (subfigures) |
Matplotlib
To understand the data better it helps to be able to visualize it in various ways. Matplotlib is the most common low-level visualization library for Python. It can create line graphs, scatter plots, density plots, histograms, heatmaps, and so on. During this course we will not go deep into details of matplotlib, instead we have just some examples spread throughout the rest of this material of its use.
Simple figure
We will start with an example. The standard way to import matplotlib is as the abbreviation plt.
[1]:
import numpy as np
import matplotlib.pyplot as plt
Let’s first have some data to visualize:
[2]:
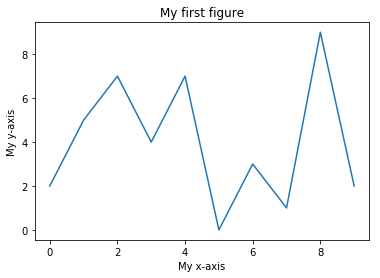
a=np.array([2, 5, 7, 4, 7, 0, 3, 1, 9, 2])
Below the plot function does the actual drawing of the graph, the rest of the function calls adjust some details of the figure. Make sure you understand how the values in the array a correspond to the features in the figure!
[4]:
plt.plot(a)                   # plot the points in the array a
plt.title("My first figure")  # Add a title to the figure
plt.xlabel("My x-axis")       # Give a label to the x-axis
plt.ylabel("My y-axis")       # Give a label to the y-axis
plt.show()                    # Tell matplotlib to output the figure.
                              # Not strictly required in notebooks (but a bit neater).
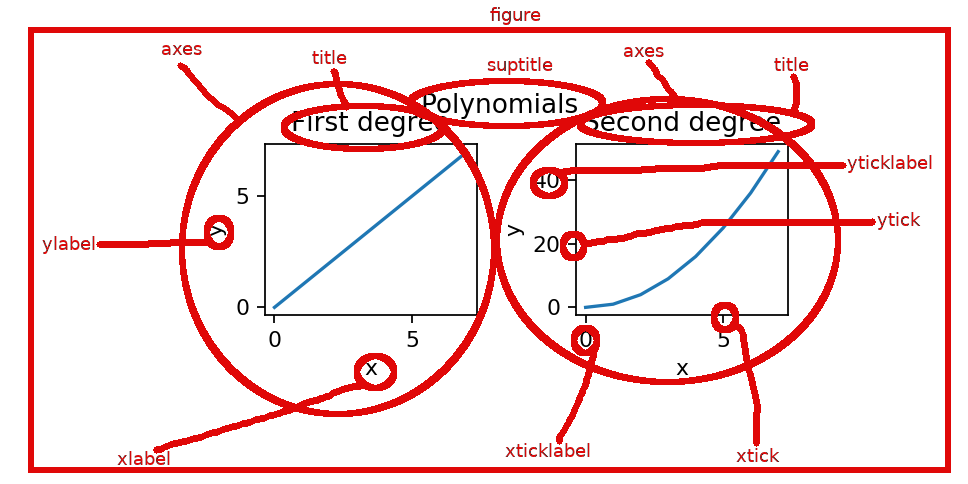
The key components of any matplotlib figure and the terminology is shown in the below image. The toplevel object is figure and it can contain one or more subfigures, which are strangely called axes in matplotlib.
In the above plot the x coordinates were implicitly set to the indices of the array a, that is, arange(10). Find out from the documentation of plt.plot how to specify the x coordinates explicitly. Find out also how to draw multiple graphs in one axes.
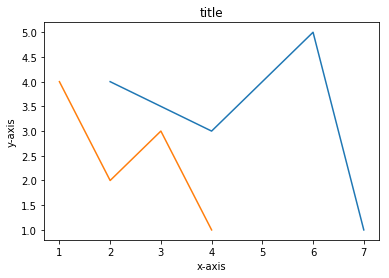
Make your main function plot the following two graphs in one axes. The first graphs has x coordinates 2,4,6,7 and y coordinates 4,3,5,1. The second graph has x coordinates 1,2,3,4 and y coordinates 4,2,3,1.
Add also a title and some labels for x axis and y axis. Note that in the non-interactive mode you have to call plt.show() for the figure to show.
The plot should look like the one below.
Subfigures
One can create a figure with several subfigures using the command plt.subplots. It creates a grid of subfigures, where the number of rows and columns in the grid are given as parameters. It returns a pair of a figure object and an array containing the subfigures. In matplotlib the subfigures are called axes. Note the one letter difference: axis is singular and axes is plural of axis. So, you can think of axes as the pair of x-axis and y-axis that defines a two dimensional
(sub)figure. An example of this:
[7]:
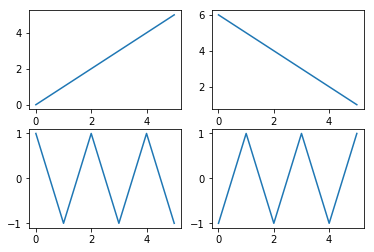
fig, ax = plt.subplots(2,2)
print(ax.shape)
ax[0,0].plot(np.arange(6))          # top left
ax[0,1].plot(np.arange(6,0,-1))     # top right
ax[1,0].plot((-1)**np.arange(6))    # bottom left
ax[1,1].plot((-1)**np.arange(1,7))  # bottom right
plt.show()
(2, 2)

If you don’t want to mess around with axes you can direct all your calls to pyplot (in a more matlabby way) like so:
[9]:
plt.subplot(2, 2, 1)    # Note the 1-indexing of subplots.
plt.plot(np.arange(6))
plt.subplot(2, 2, 2)
plt.plot(np.arange(6, 0, -1))
plt.subplot(2, 2, 3)
plt.plot((-1)**np.arange(6))
plt.subplot(2, 2, 4)
plt.plot((-1)**np.arange(1, 7))
plt.show()
Note that in this notebook we have used both the function plt.plot and the similar method plot of the axes object. The functions in plt namespace refer to the global variables that tell what is the current figure and what is the current axes. If we want to refer to multiple figures and/or axes’ at the same, we cannot use the function in plt. Instead, we can refer to each figure or axes object and use their methods to do the drawing.
Note the similarity to the random number generators in Python: the function like np.random.randn use the global random number generator. But if you want to use multiple random number generators at the same time, you first have to create the generators using the call rng1=np.random.RandomState(seed) and then use the method rng1.randn.
So with both random number generators and matplotlib plots you can choose between using one global object, and functions referring to it, at a time, or using several objects and their methods to refer to multiple objects at the same time.
Write function subfigures that creates a figure that has two subfigures (two axes in matplotlib parlance). The function gets a two dimensional array a as a parameter. In the left subfigure draw using the plot method a graph, whose x coordinates are in the first column of a and the y coordinates are in the second column of a. In the right subfigure draw using the scatter method a set of points whose x coords are again in the first column of a and whose y
coordinates are in the second column of a. Additionally, the points should get their color from the third column of a, and size of the point from the fourth column of a. For this, use the c and s named parameters of scatter, respectively
Test your function subfigure from the main function.
Other data visualization libraries for Python
The development of matplotlib library started already in 2003. In some ways this old age shows as figures that don’t look very pretty compared to the figures created with more modern alternatives. Also, it can be quite complicated to create a simple figure. Here’s a list of some common modern libraries:
- Seaborn is a higher-level plotting library that is build on top of matplotlib. It allows easy creation of more complicated plots. The figures it produces also look prettier than ones created by matplotlib with its default settings.
- Bokeh creates html pages as output that can be viewed with a web browser. Since it doesn’t create static images, like many other plotting libraries, but html pages which can containg Javascript, this allows the plots to be interactive. Interactive can here mean that you can e.g. zoom or pan the image, or you can have control elements (button, sliders, etc) that adjust the image.
- Holoviews: even higher-level library build on top of Bokeh and matplotlib
- Plotly: A powerful tool for creating interactive plots.